
WP2 Irradiance and proxy data exploitation
Key tasks and achievements:
1. Homogeneous assessment of existing solar irradiance datasets
2. SSI Database and detailed dataformat (direct link to database)
3. Improvement of specific solar irradiance and proxy records
1. Homogeneous assessment of existing solar irradiance datasets
A global study of all solar spectral irradiance datasets has been performed. Historical datasets obtained from pioneer missions (e.g., San Marco or OSO missions) have been disregarded because of the too large uncertainties on the observed irradiance variability, or insufficient documentations. All other datasets have been through the same processing where outliers were detected and all « bad » points (outliers, gaps, data with uncertain time or wavelength, ect.) were replaced using a proxy model on the short time scale (proxy models have very good agreement with data on rotational time scales).
An independent precision, intended as the uncertainty on the daily repeatability, of observed SSI, has then be estimated. Finally, a method has been developed to estimate the stability, intended as the uncertainty on the long time scale repeatability, of each time series. Although these uncertainties are not determined from the instrumentation, they allow a measure to inter compare the SSI time series. Figure 1 shows the general processing that each dataset went through and Figure 2 shows an example for the UARS/SUSIM data.
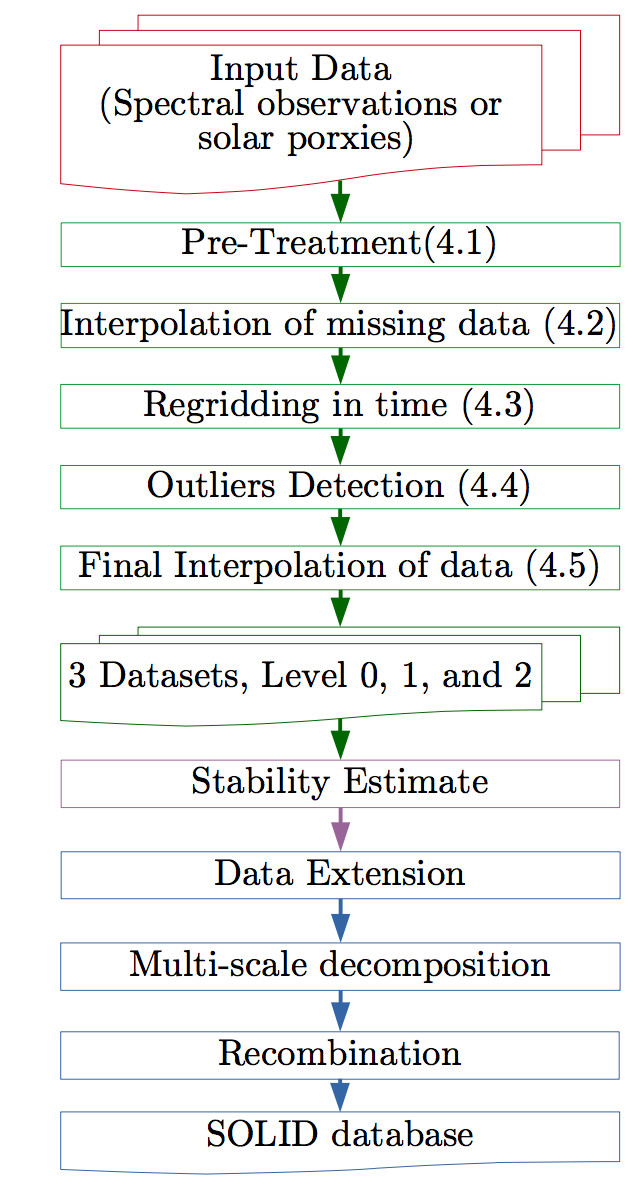
As illustrated in Figure 1 and Figure 2, there are three data levels that are included in the SSI database:
-
Level 0 is the untouched original data,
-
Level 1 is intermediary, and
-
Level 2 contains SSI with all « suspect » data points being replaced by a proxy interpolation, and including the precision and stability estimates. The Level 2 SSI datasets are the input dataset for the SOLID observational composite as described in WP4.
Figure 2 illustrates the effect of the interpolation procedure on the uncertainty estimate.
test

Figure 2: A sample of the three provided levels of UARS/SUSIM, the original data, named level 0 (top), re-gridded and missing data interpolated as level 1 (middle), and our best-estimate, level 2, where outliers have been removed and re-interpolated (bottom). One solar proxy, Mg II, is shown for comparison (black dots). The error-bars represent our estimate of the precision, including the induced uncertainty of each method. Also shown are the values of all set flags. For example, a value of 24 means that bit 3 (23) and 4 (24) are set, marking this data-point as both being detected as an outlier (8) and re-interpolated in the final interpolation (16); from Schöll et al., (2016).
2. Database and detailed dataformat
Level 2 SOLID SSI dataset can be accessed directly here.
Each datafile contains different fields that are explained in the header and that we remind here:
TIME: Time value in number of days since 1st January 1980
WAVELENGTH: Wavelength in nm.
DATA: Irradiance in W/m^2/nm (W/m^2 for broad-band instrument)
INSTRUMENT_ACCURACY: Irradiance accuracy as determined from the instrument team. 0 if not present (means refer to original publication or data release)
INSTRUMENT_STABILITY: Irradiance stability (long-term repeatability, uncertainty on the instrumental trend) as determined from the instrument team. 0 if not present
INSTRUMENT_PRECISION: Irradiance precision (short-term repeatability or stability) as determined from the instrument team. 0 if not present
SOLID_FLAG: Flag value between 0 and 31 indicating if the observed original irradiance has been modified or not:0: Original data untouched.1: Original data were missing or obvious outlier greater than 16 sigmas2: Several irradiance values for one date4: Data have been regridded in time to be centered around noon.8: Data have been detected as outliers using an auto regressive models16: Data points ave been replaced with a local proxy fitting model (done for data points already having flag value between 1 and 8). For ex., one missing data point that has been replaced with a local proxy fitting model will have value 16+1=17
SOLID_PRECISION: Irradiance precision (short-term repeatability or stability) in W/m^2/nm) as determined within SOLID. See Scholl et al., 2016
SOLID_STABILITY: Irradiance stability (long-term repeatability, uncertainty on the instrumental trend) in %/year as determined within SOLID.
More details are given in Schöll et al. (2016a) and in Kretzschmar et al. (2016, in prep).
3. Improvement of specific solar irradiance and proxy records.
Work was performed on different datasets and has lead to several improvements:
-
Mg II index: Resolution of a discrepancy between the LASP and Bremen Mg II composite time series. (Snow et al., 2014)) and estimation of the uncertainties on the Bremen Mg II index composite (http://www.iup.uni-bremen.de/gome/gomemgii.html).
-
Historical observations of solar spots were obtained all across the world by different teams. These records has been merged into a single comprehensible composite catalog, allowing us to access more detailed information than sunspot number back to 1874 (Lefevre and Clette, 2014)
-
Important work as been performed on the ISS/SOLSPEC observations. A reference spectrum for the last minimum (between SC23 and SC24) has been derived (Thuillier et al., 2013) and compared with observed and modeled spectrum (Thriller et al., 2014)
-
The Longest EUV irradiance time series has been built from the SOHO/CDS observations. Extensive work has been done on the calibration to compute solar irradiance in several EUV lines from 1998 to 2015 (Del Zanna et al., 2015a) This has been compared with SDO/EVE, TIMED/SEE, and SOHO/SEM (Del Zanna et al., 2015b).
References with involvement of WP2
-
Carrasco, V.M.S., Lefevre, L., Vaquero, J.M., Gallego, M.C., 2015, Equivalence relations between the Cortie and Zürich Sunspot Group Morphological Classifications, Solar Physics, 290, 1445, DOI: 10.1007/s11207-015-0679-y.
-
G. Cessateur, W. Schmutz, C. Wehrli, J. Grobner, M. Haberreiter, M. Kretzschmar, E. Rozanov, M. Schöll, A. Shapiro, G. Thuillier, T. Egorova, W. Finsterle, N. Fox, J.-F. Hochedez, S. Koller, M. Meftah, P. Meindl, S. Nyeki, D. Pfiffner, H. Roth, M. Rouze , M. Spescha, R. Tagirov, L. Werner, J.-U. Wyss, Solar irradiance observations with PREMOS filter radiometers on the PICARD mission: In-flight performance and data release , A&A, in press (2015)
-
Del Zanna, G. and Andretta, V. (2015). The EUV spectrum of the Sun: Irradiances during 1998-2014, \aap, 584(), A29
-
Del Zanna, G., Wieman, S. R., Andretta, V., and Didkovsky, L. (2015). The EUV spectrum of the Sun: SOHO, SEM, and CDS irradiances, Astronomy and Astrophysics, 581, A25
-
Kretzschmar, M., Variation with Temperature of the Flare Fluence Scaling Exponent , Solar Physics, in press, doi : 0.1007/s11207-015-0783-z (2015)
-
Lefevre, L. and Clette, F., Survey and merging of sunspot catalogs, Sol. Phys., 289, 545-561 (2014).
-
Schmidtke, G., Avakyan, S. V., Berdermann, J., Bothmer, V., Cessateur, G., Ciraolo, L., Didkovsky, L., Dudoc de Wit, T., Eparvier, F. G., Gottwald, A., Haberreiter, M., Hammer, R., Jacobi, C., Jakowski, N., Kretzschmar, M., Lilensten, J., Pfeifer, M., Radicella, S. M., Schäfer, R., Schmidt, W., Solomon, S. C., Thuillier, G., Tobiska, W. K., Wieman, S, Woods, T. N., 2015, Where does the Thermospheric Ionospheric GEospheric Research (TIGER) Program go?, Advances in Space Research, in press, DOI: 10.116/j.asr.2015.07.043. (2015)
-
Schöll, M., Dudok de Wit, T., Kretzschmar, M., Haberreiter, M., Making of a solar spectral irradiance data set: data and methods, Journal of Space Weather and Space Climate, in press
-
Snow, M., Weber, M., Machol, J., Viereck, R., Richard, E., 2014, Comparison of Magnesium II core-to-wing ratio observations during solar minimum 23/24, Journal of Space Weather Space Climate 4, A04, DOI: 10.1051/swsc/2014001
-
Thuillier, G., Melo, S. M. L., Lean, J., Krivova, N. A., Bolduc, C., Fomichev, V. I., Charbonneau, P., Shapiro, A. I., Schmutz, W., and Bolsée, D. (2013). Analysis of Different Solar Spectral Irradiance Reconstructions and Their Impact on Solar Heating Rates, Solar Physics, 289(4), 1115--1142
-
Thuillier, G., Schmidtke, G., Erhardt, C., Nikutowski, B., Shapiro, A. I., Bolduc, C., Lean, J., Krivova, N., Charbonneau, P., Cessateur, G., Haberreiter, M., Melo, S., Delouille, V., Mampaey, B., Yeo, K. L., and Schmutz, W. (2014). Solar Spectral Irradiance Variability in November/December 2012: Comparison of Observations by Instruments on the International Space Station and Models, Solar Physics, 289(12), 4433—4452
-
Thuillier, G., Bolsée, D., Schmidtke, G., Foujols, T., Nikutowski, B., Shapiro, A. I., Brunner, R., Weber, M., Erhardt, C., Hersé, M., Gillotay, D., Peetermans, W., Decuyper, W., Pereira, N., Haberreiter, M., Mandel, H., and Schmutz, W. (2013). The Solar Irradiance Spectrum at Solar Activity Minimum Between Solar Cycles 23 and 24, Solar Physics, 289(6), 1931--1958
Submitted or in preparation:
-
Kretzschmar, M., Scholl, M. Dudok de Wit, T., On the long term variations in SSI datasets, in preparation
-
Lefèvre, L., Aparicio, A., Gallego, M.C. & Vaquero, J.M., submitted, Solar Physics